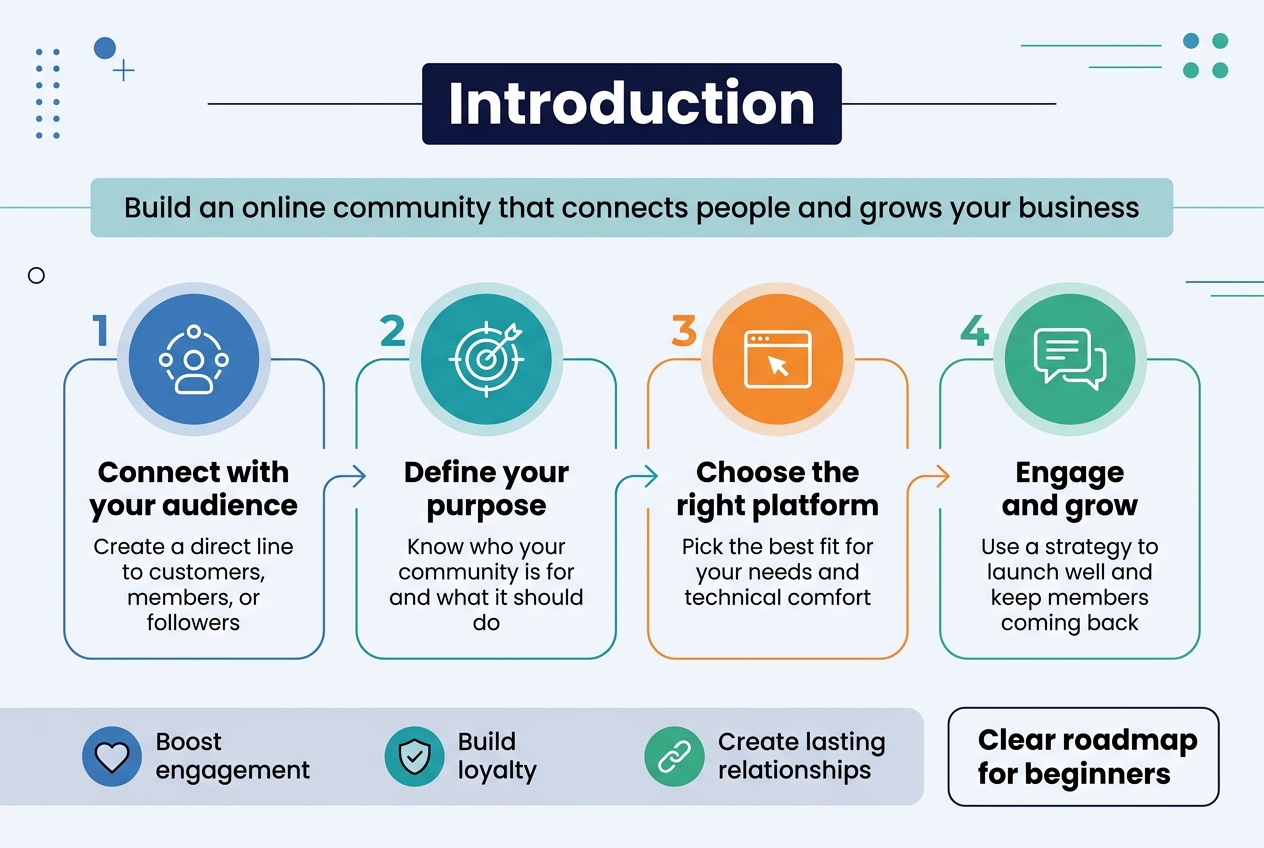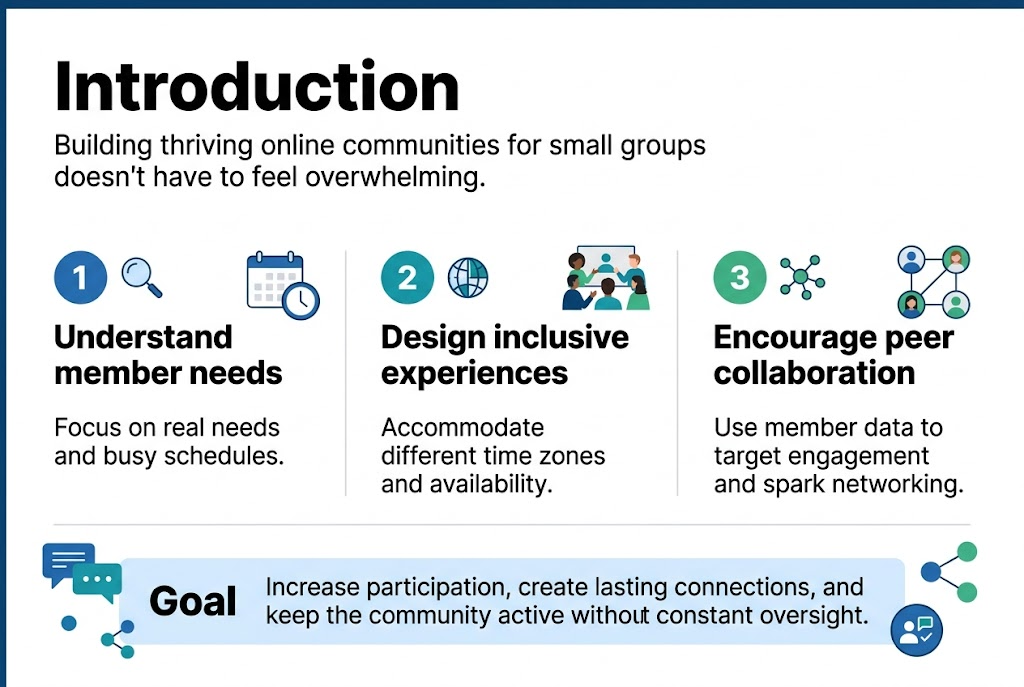
Building thriving online communities for small groups doesn’t have to feel overwhelming. Small business owners, nonprofit leaders, and community managers need practical strategies that actually drive member involvement and create lasting connections.
Creating successful online community engagement starts with understanding your members’ real needs and schedules. Most small group leaders struggle with low participation rates and members who join but never interact. The solution lies in smart community building approaches that work with people’s busy lives, not against them.
We’ll explore how to design inclusive experiences that accommodate different time zones and availability, plus show you how to use your existing member data to create targeted engagement strategies. You’ll also discover proven methods for encouraging peer-to-peer networking and collaboration that keeps your community active without constant oversight from you.
Design Inclusive Online Experiences That Accommodate Diverse Schedules
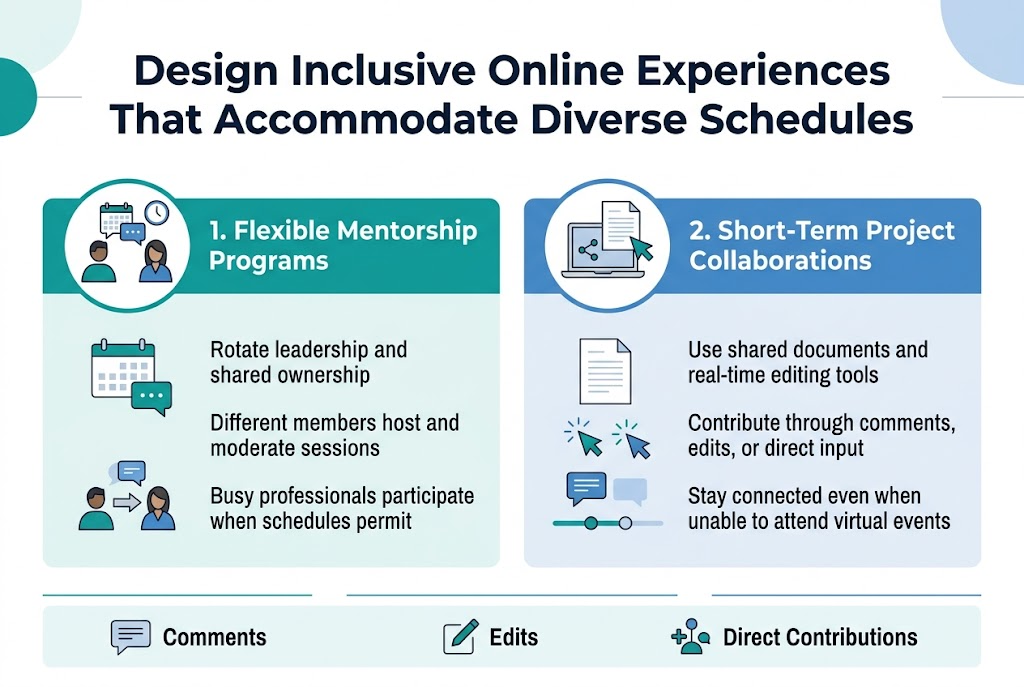
Implement Flexible Mentorship Programs for Busy Professionals
Creating mentorship programs that adapt to diverse schedules requires rotating leadership and shared ownership among community members. Rather than traditional hierarchical models, implement collaborative approaches where different members can host and moderate sessions, ensuring everyone feels genuine ownership of the community building process. This flexibility allows busy professionals to participate when their schedules permit while maintaining meaningful engagement metrics.
Create Short-Term Project Collaborations That Fit Any Timeline
Design collaborative projects using shared documents and real-time editing tools that accommodate various availability levels. When members can contribute to networking activities through online collaboration platforms, they remain connected even when unable to attend virtual events. These short-term collaborations provide multiple engagement options, allowing members to participate through comments, edits, or direct contributions based on their current capacity and member involvement preferences.
Leverage CRM Data to Understand and Segment Your Community
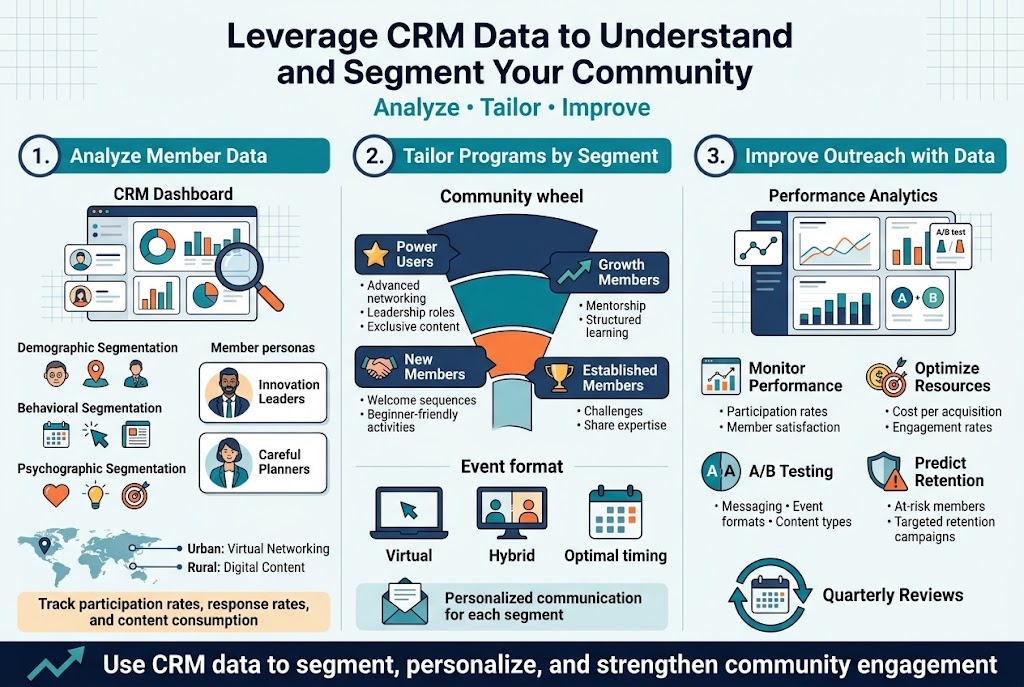
Analyze Member Data to Identify What Resonates with Different Groups
Understanding your community members starts with analyzing the data patterns that reveal their true preferences and behaviors. Demographic segmentation helps you categorize members by age, location, or professional background, while behavioral segmentation examines how they interact with your content, events, and other community activities.
Consider implementing psychographic segmentation to understand members’ values, interests, and motivations for joining your community. This deeper insight reveals what drives engagement beyond surface-level characteristics. For instance, you might discover that some members are “Innovation Leaders” who eagerly adopt new community features, while others are “Careful Planners” who prefer proven engagement formats.
Geographic segmentation proves particularly valuable for small communities with members across different regions or time zones. Members in urban areas might prefer virtual networking events, while those in rural locations may value digital content and online collaboration tools more heavily.
Track key engagement metrics across these segments, including participation rates in events, response rates to communications, and content consumption patterns. This data reveals which community building strategies resonate most with each group, enabling you to optimize your member involvement approaches.
Tailor Programs Based on Specific Segment Preferences and Behaviors
With clear segmentation insights, you can design targeted programs that speak directly to each group’s needs. Value-based segmentation helps prioritize your efforts by categorizing members based on their engagement level and potential contribution to the community.
High-engagement members might benefit from advanced networking opportunities, leadership roles, or exclusive content access. These “Power Users” often appreciate complex features and deeper community interaction. Mid-tier members with growth potential respond well to structured learning programs and mentorship opportunities that gradually increase their involvement.
Create personalized communication strategies for each segment. Early-stage community members require nurturing through welcome sequences and beginner-friendly activities, while established members need ongoing challenges and opportunities to contribute their expertise.
Implement different event formats based on segment preferences. Some groups thrive in virtual events with interactive elements, while others prefer hybrid options that accommodate diverse schedules. Use your CRM data to determine optimal timing, format, and content themes for each segment’s virtual events.
Use Data-Driven Insights to Improve Outreach Effectiveness
Regular analysis of your segmentation data drives continuous improvement in community engagement strategies. Monitor performance metrics by segment to identify which approaches generate the highest participation rates and strongest member satisfaction scores.
Track cost per acquisition and engagement rates across different segments to optimize resource allocation. This analysis helps you focus your community building efforts on the most responsive groups while developing targeted strategies to re-engage less active segments.
Implement A/B testing of segment approaches to refine your communication and engagement tactics. Test different messaging styles, event formats, and content types across segments to identify what drives the strongest responses from each group.
Establish quarterly reviews of your segmentation strategy, updating criteria based on new behavioral data and evolving community dynamics. This ensures your segments remain relevant and actionable as your community grows and changes.
Use predictive analytics to identify at-risk members early and create targeted retention campaigns. By understanding engagement patterns within each segment, you can proactively address potential churn before members become inactive, maintaining stronger long-term community building success.
Enable Peer-to-Peer Engagement for Stronger Community Bonds
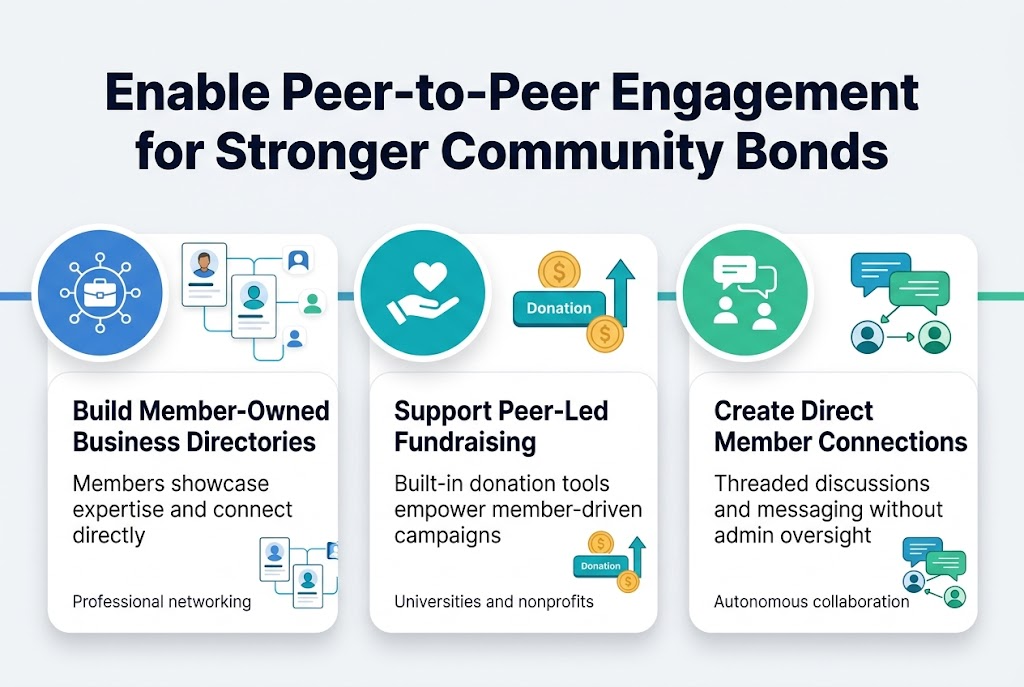
Build Member-Owned Business Directories for Professional Networking
Peer-to-peer engagement strengthens community bonds by enabling members to connect directly without constant admin oversight. Professional networks and association platforms prioritize belonging over attention by providing spaces for meaningful connection. Building member-owned business directories allows professionals to showcase their expertise while facilitating authentic networking opportunities that go beyond traditional LinkedIn-style interactions.
Support Peer-Led Fundraising Campaigns and Initiatives
Community platforms with built-in donation tools and fundraising capabilities empower members to drive their own initiatives. Universities and nonprofit organizations particularly benefit from embedded donation features that enable peer-to-peer fundraising campaigns. This approach reduces administrative burden while creating opportunities for member advocacy and organic community growth through shared goals.
Create Platforms for Members to Connect Directly Without Admin Oversight
Real-time messaging capabilities and member directory features enable authentic peer collaboration without requiring constant moderation. Advanced community platforms offer threaded discussions, direct messaging, and customizable spaces where members can self-organize around shared interests. This autonomous interaction model fosters deeper engagement while allowing community builders to focus on strategic growth rather than micromanaging every conversation.
Revitalize Your Event Strategy with Virtual and Hybrid Options
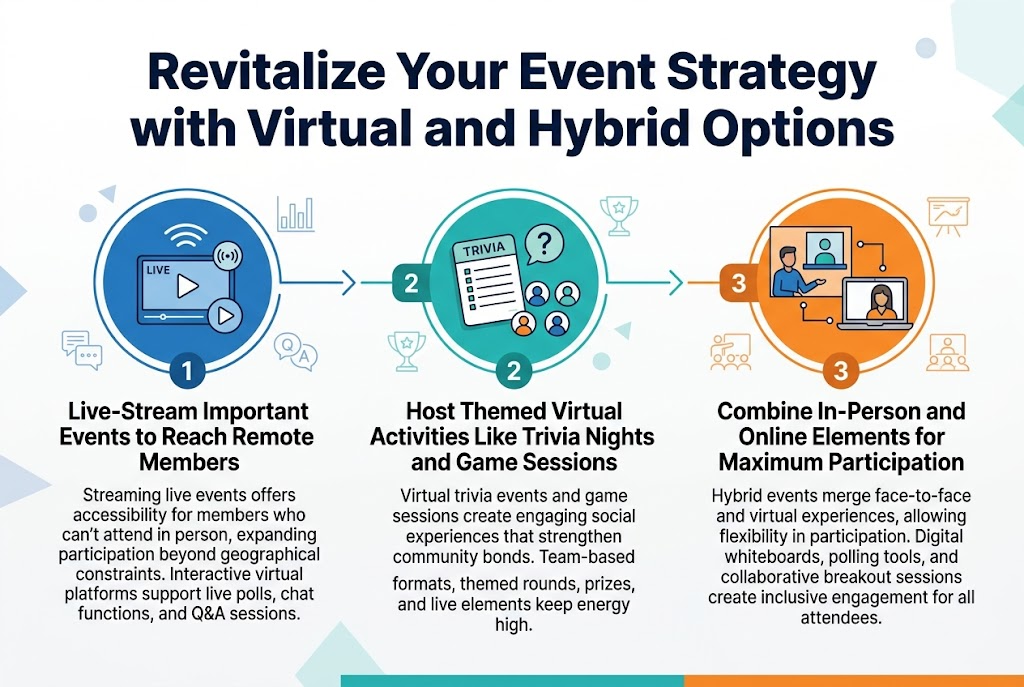
Live-Stream Important Events to Reach Remote Members
Streaming live events offers accessibility for members who can’t attend in person, expanding participation beyond geographical constraints. This approach combines cost-effectiveness with broader reach, allowing organizations to connect with global audiences through virtual platforms that support interactive features like live polls, chat functions, and Q&A sessions for enhanced engagement.
Host Themed Virtual Activities Like Trivia Nights and Game Sessions
Virtual trivia events and game sessions create engaging social experiences that strengthen community bonds. These activities work well for small groups, offering interactive competition through team-based formats with multiple themed rounds covering topics like pop culture or history, while incorporating prizes and live elements to maintain high energy levels.
Combine In-Person and Online Elements for Maximum Participation
Hybrid events merge the best aspects of face-to-face and virtual experiences, allowing attendees flexibility in participation methods. This format maximizes attendance by accommodating diverse preferences while creating inclusive environments where both in-person and remote participants can engage equally through digital whiteboards, polling tools, and collaborative breakout sessions.
Harness the Power of Storytelling and Digital Content
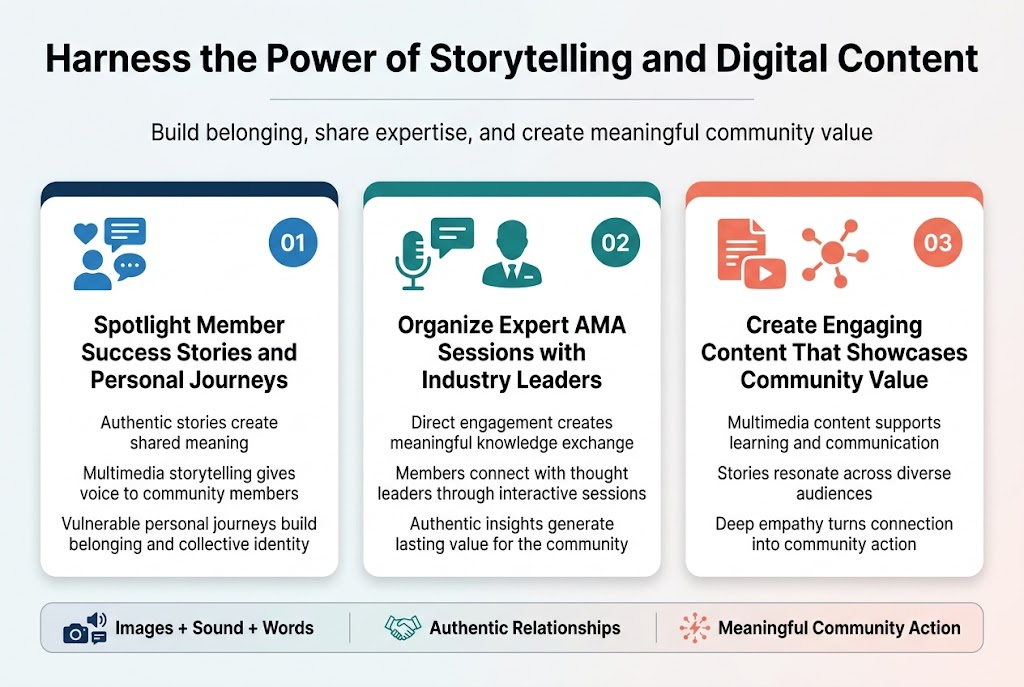
Spotlight Member Success Stories and Personal Journeys
Stories fundamentally connect people through shared experiences and create meaning through the approach to others. Digital storytelling harnesses this ancient human tradition by incorporating multimedia elements like images, sound, and words to create narratives that democratize the record and give voice to community members whose stories might otherwise remain unheard.
Successful community storytelling requires authentic relationships between storyteller, story, and listener, where member narratives become powerful tools for building belonging and collective identity through the vulnerable sharing of personal journeys.
Organize Expert AMA Sessions with Industry Leaders
Expert-led sessions create opportunities for meaningful knowledge exchange and community building through direct engagement. These interactive formats allow community members to connect with thought leaders while generating valuable content that showcases your community’s access to industry expertise.
The key lies in fostering genuine connections where experts can share authentic insights while members feel empowered to engage meaningfully, creating lasting value for both participants and the broader community.
Create Engaging Content That Showcases Community Value
Digital content creation serves multiple purposes – from pedagogical tools that facilitate active learning to powerful communication vehicles that convey organizational messages. The most effective community content combines storytelling elements with multimedia formats to create narratives that resonate across diverse audiences and demonstrate tangible member benefits.
Content should move beyond surface-level engagement to create stories that ask difficult questions and demand true empathy, transforming emotional connections into springboards for meaningful community action and sustained member involvement.
Demonstrate Tangible Impact to Keep Members Engaged
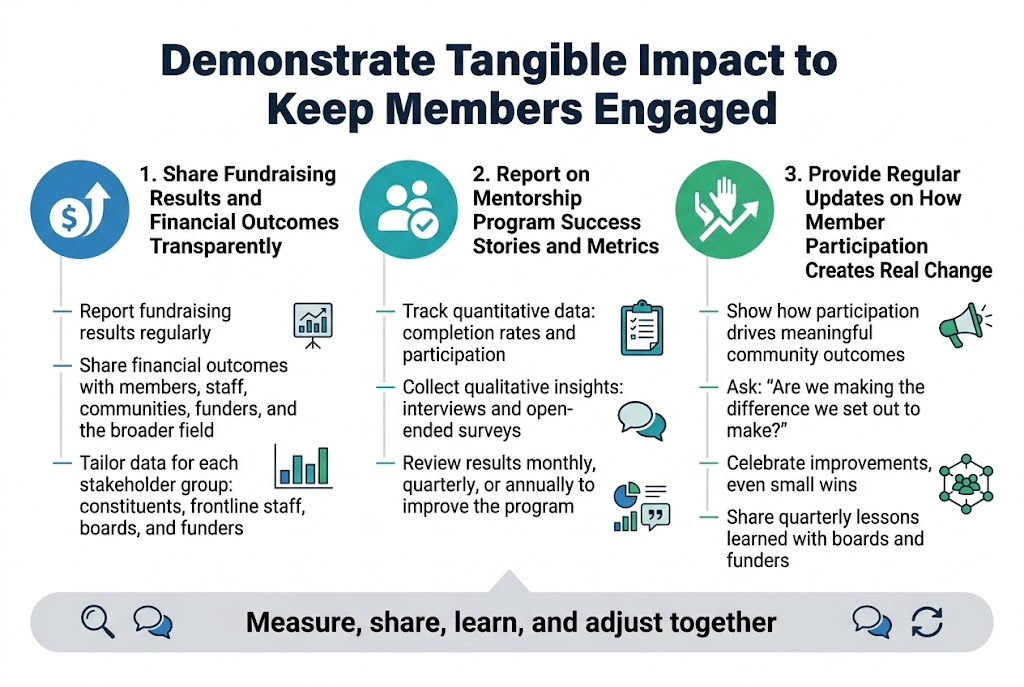
Share Fundraising Results and Financial Outcomes Transparently
Demonstrating tangible financial impact builds trust and sustains member engagement in your online community. Clear reporting on fundraising results creates accountability that community members value. When tracking financial outcomes, establish key performance indicators that align with your organization’s values and community expectations.
Transparency in financial reporting requires consistent documentation of how funds are raised, allocated, and utilized. Share specific dollar amounts raised, percentage of goals achieved, and detailed breakdowns of how community contributions create measurable change. This approach moves beyond basic participation counts to showcase the depth of your community’s collective impact.
Implement regular reporting cycles that include both quantitative metrics and qualitative insights from community members. Consider tracking metrics such as the frequency of financial data usage across different projects, the number of community-driven funding initiatives, and the percentage of alignment between community priorities and actual fund allocation.
Report on Mentorship Program Success Stories and Metrics
Meaningful measurement of mentorship programs requires tracking both relationship quality and tangible outcomes. Focus on metrics that capture the depth of engagement rather than simple participation numbers. Track mentor-mentee pairing success rates, program completion percentages, and long-term relationship sustainability indicators.
Document specific success stories that illustrate how mentorship creates real change in members’ lives. Collect qualitative feedback through structured interviews or surveys that assess relationship satisfaction, skill development progress, and goal achievement rates. This narrative approach provides rich context that complements quantitative data.
Measure the variety of backgrounds represented in your mentorship program, including age groups, professional experience levels, and geographic reach. Ensure your engagement metrics reflect diversity and inclusion efforts, tracking whether historically underrepresented groups are not only participating but truly benefiting from mentorship opportunities.
Provide Regular Updates on How Member Participation Creates Real Change
Establishing clear communication channels for impact reporting strengthens community bonds and encourages continued member involvement. Regular updates should demonstrate the direct connection between individual participation and collective outcomes. Track how community input influences decision-making processes and shapes organizational priorities.
Implement systematic approaches to measure participation impact, including the number of member-suggested changes that get implemented, the frequency of community feedback integration, and the percentage of compatibility between member priorities and organizational actions. These engagement metrics provide concrete evidence of how member participation drives meaningful change.
Develop feedback loops that show members how their contributions influence broader community direction. Share specific examples of policy changes, program modifications, or resource allocations that resulted directly from member input. This transparency in impact reporting builds trust and demonstrates genuine commitment to collaborative community building and member involvement.
Building a thriving online community for small groups requires intentional strategy and genuine commitment to member engagement. By designing inclusive experiences that accommodate diverse schedules, leveraging your CRM data to understand different segments, and enabling meaningful peer-to-peer connections, you create the foundation for lasting community bonds. When you combine flexible virtual and hybrid events with compelling storytelling and digital content, you transform passive members into active participants who feel valued and connected.
The most successful online communities consistently demonstrate the tangible impact of member participation, whether through showcasing fundraising achievements, mentorship outcomes, or peer collaboration results. Start implementing these strategies one at a time, focusing on what resonates most with your specific community. Remember, sustainable growth comes from authentic engagement and showing members that their time and contributions truly matter to the group’s collective success.